Mission Statement:
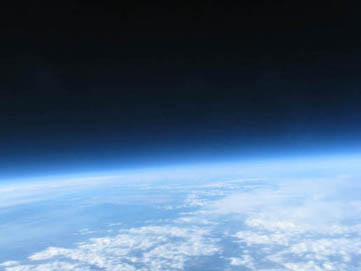
The purpose of the mission is to send E. coli bacteria, strain K-12, to an approximate altitude of 30,000 meters in a BalloonSat, and to analyze how the bacteria’s growth rate is affected by the radiation in the upper atmosphere.

Mission Expectations and Results
It was hoped that the extent to which the bacteria was able to recover from the change in climate would be discovered. We hypothesized that a large amount, though not all, of the bacteria would die due to the high amounts of radiation. The expected amount of radiation in the upper atmosphere by the Geiger counter is, at its peak, was 1500 counts per minute. Though we did get a lower count, this caused the growth curve of the bacteria to be retarded, shifting the graph to the right. The heater in the satellite kept the interior warm so the bacteria were not killed by the cold and the growth curve was not affected. This way, the resulting data was traced to the amounts of radiation, rather than temperature. The resulting distinction in the growth curve, therefore, shows a significant developmental difference between the control and the one sent to 30,000 meters.
Radiation
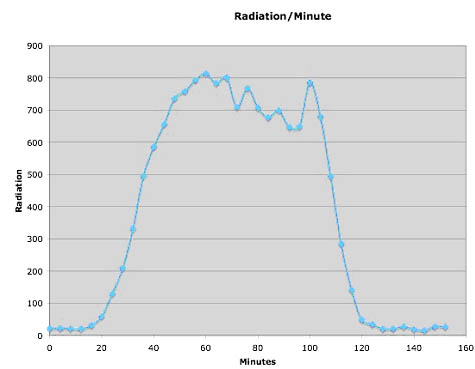
The purpose of flying a Geiger counter was to be able to quantify how a given amount of radiation affected the bacteria; this way one could specifically say that if it is exposed to this much radiation, the bacterial growth rate will be retarded by this much.
After the data taken from our Geiger counter was compiled, we were able to analyze it by compiling the amount of counts that occurred over a time interval of four minutes, and graphing it as a function of time (see figure below).
Pressure Tube Experiment Results:
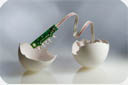
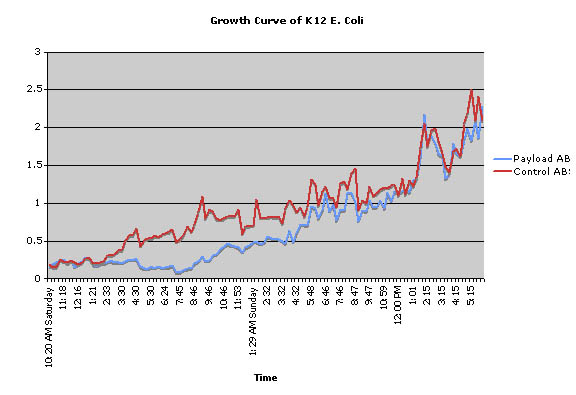
The E. coli bacteria were grown in a broth, which after the flight, were tested with a spectrophotometer. The amount of light that the spectrophotometer could detect through the broth would be proportional to the density of the broth; in other words, indicating how much E. coli replication had taken place. The bacteria were sent up in a pressure tube on the BalloonSat. When we retrieved our payload, we immediately began to put the broth through the spectrophotometer. As per our expectations, the two samples of bacteria started out with the same ABS values, but the ground sample ABS increased more rapidly until after around 50 hours when the payload ABS caught up to it. This data is summarized in the graph below.
Team BioSat:
Lauren Persons
Kirstyn Johnson
Ryder Whitmire
Lenny Komow
Dave Borncamp