
The procedure that follows provides a step by step method for determining the critical temperature of the superconductor sample contained within the superconducting susceptibility probe included in the Superconducting Magnetic Susceptibility Kit. The experimenter will simultaneously measure the magnetic susceptibility of the sample as well. This probe consists of a 0.5 inch long coil of wire (approximately 400 turns) around a 0.5 inch diameter superconductor rod. A thermocouple is also attached for temperature measurement.
This experiment is based on the expulsion of a magnetic field by the superconducting sample (the Meissner Effect). A current introduced into the coil will generate a magnetic field. When cooled below the Critical Temperature, the sample expels the induced field which can be seen by a distinct change in the inductance of the coil. Analysis of the data collected in this procedure reveals a sharp transition point at the Critical Temperature, Tc, of the sample, and can also be used to compute the magnetic susceptibility of the superconductor.
Procedure
- ACTION
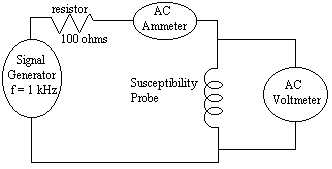
Set up the apparatus as shown below in figure 11. A 100 ohm resistor should be connected in series with the signal generator to prevent any damage that might otherwise occur due to the low impedance of the susceptibility probe. Set the signal generator output a sine wave (ac) at a frequency of approximately 1 kHz (integer multiples of 60 Hz should be avoided). - ACTION
Carefully straighten the thermocouple leads. Attach them to a dc voltmeter with a precision of at least 0.01 mV. - ACTION
Insert the susceptibility probe into the CSI Sand Cryostat™. Fill the cryostat with enough sand to completely cover the probe. The amount of sand can be used to vary the rate of warming of the sample. - ACTION
Add liquid nitrogen slowly until the temperature is below 80 K. The thermocouple should read about -0.16 mV at room temperature and about +6.42mV in liquid nitrogen. - ACTION
Allow the sample to warm slowly. Periodically record the current (I), the voltage across the coil (VL), and the thermocouple temperature, until the sample warms to about 120 K.
RESULT
As the sample reaches the critical temperature, the induction voltage (VL) will increase dramatically. A slower warming rate at this point is advantageous in order to obtain accurate measurements.
The resistance of the coil (RL) is temperature dependent, therefore we now need to determine the value of RL as a function of temperature. The following procedure accomplishes this task:
- ACTION
Connect an ohmmeter to the inductor leads to record the resistance (RL), and a dc voltmeter to the thermocouple leads to record the temperature of the coil. - ACTION
Using the same procedures as in the first part of the experiment, immerse the probe in the Sand Cryostat and cool it with liquid nitrogen to below 80 K. - ACTION
Allow the probe to warm gradually. Record both RL and the thermocouple temperature continuously until the probe warms to about 120 K.
RESULT
You now have a measurement of the resistance of the coil as a function of temperature. You will need this information to accurately compute the inductance of the coil, and magnetic susceptibility of the sample.
Procedure
- Students should not touch any object cooled in liquid nitrogen. If the apparatus needs to be moved, tongs or protective gloves should be used.
- If a sensitive lab surface is being used, a block of wood or thick foam should be placed between the bench and apparatus in order to prevent damage.
ANALYSIS OF DATA
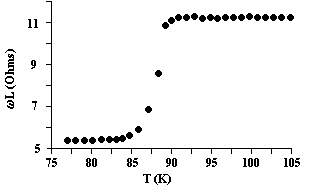
The critical temperature (Tc) at which the superconducting transition takes place can be seen clearly by plotting the inductance of the coil vs. temperature. An example plot is given in figure 12 on the following page. The inductance of the coil (wL ) can be computed using the following equation:
wL = ((VL/I)2-RL2)1/2
Where VL is the voltage of inductance (the ac voltage measured across the black coil leads), and RL is the resistance of the coil. Since ceramic superconductors do not have sharply defined critical temperatures (the transition is visible over a range of 5K in figure 12), the midpoint of the range is usually taken as Tc.
An ideal superconductor screens the B-field completely at B-fields lower than the critical field. This makes a superconductor perfectly diamagnetic and thus the magnetic susceptibility (X) is equal to -1.
If the coil contains a sample with X not equal to -1, the magnetic flux through the coil will change, resulting in a change in the inductance of the coil. The inductance of a coil measured in a medium of susceptibility X is given by:
L = Lo(1+X)
Where Lo is the inductance of the coil in a vacuum. This equation holds for any sample provided that the sample occupies all the space in which the coil produces a field. Since our sample occupies most of the volume (sample diameter = 1.26 cm, coil diameter = 1.36cm) we can approximate the inductance (L) by adjusting the above equation to account for this difference:
L = Lo(1+fX)
Where f is the fraction of the coil volume occupied by the sample.
It follows that X is given by the equation:
X = (L/Lo - 1)/f
Calculate X with the data collected in the previous exercises and plot X vs. T. You will notice that the plot yields the same type of graph as wL, as well as the same critical temperature.
You may notice that although the superconducting transition is clearly visible, the susceptibility in the superconducting state is not exactly -1. This is due in part to geometrical corrections which were neglected in our equation for X, which can result in an error in susceptibility. In addition, polycrystalline samples of YBa2Cu3O7 contain grains of material with large lower critical fields which undergo a transition at 90 Kelvin, but material between the grains has smaller lower critical fields and not all of this material will become superconducting in the apparatus. This can be verified by noticing that the fraction of the sample which screens the B-field is smaller in an applied field of 30 Gauss than in an applied field of 3 Gauss, and the transition temperature is depressed in the stronger field.
We thank Professor Howard Lukefahr and his team at Whittier College, California for the basis and guidance for this experiment.
Information Courtesy of CSI Superconductors